 ar
ar bg
bg hr
hr cs
cs da
da nl
nl fi
fi fr
fr de
de el
el hi
hi it
it ko
ko no
no pl
pl pt
pt ro
ro ru
ru es
es sv
sv tl
tl iw
iw id
id lv
lv lt
lt sr
sr sk
sk sl
sl uk
uk vi
vi et
et hu
hu th
th tr
tr fa
fa ms
ms hy
hy ka
ka ur
ur bn
bn mn
mn ta
ta kk
kk uz
uz ku
ku
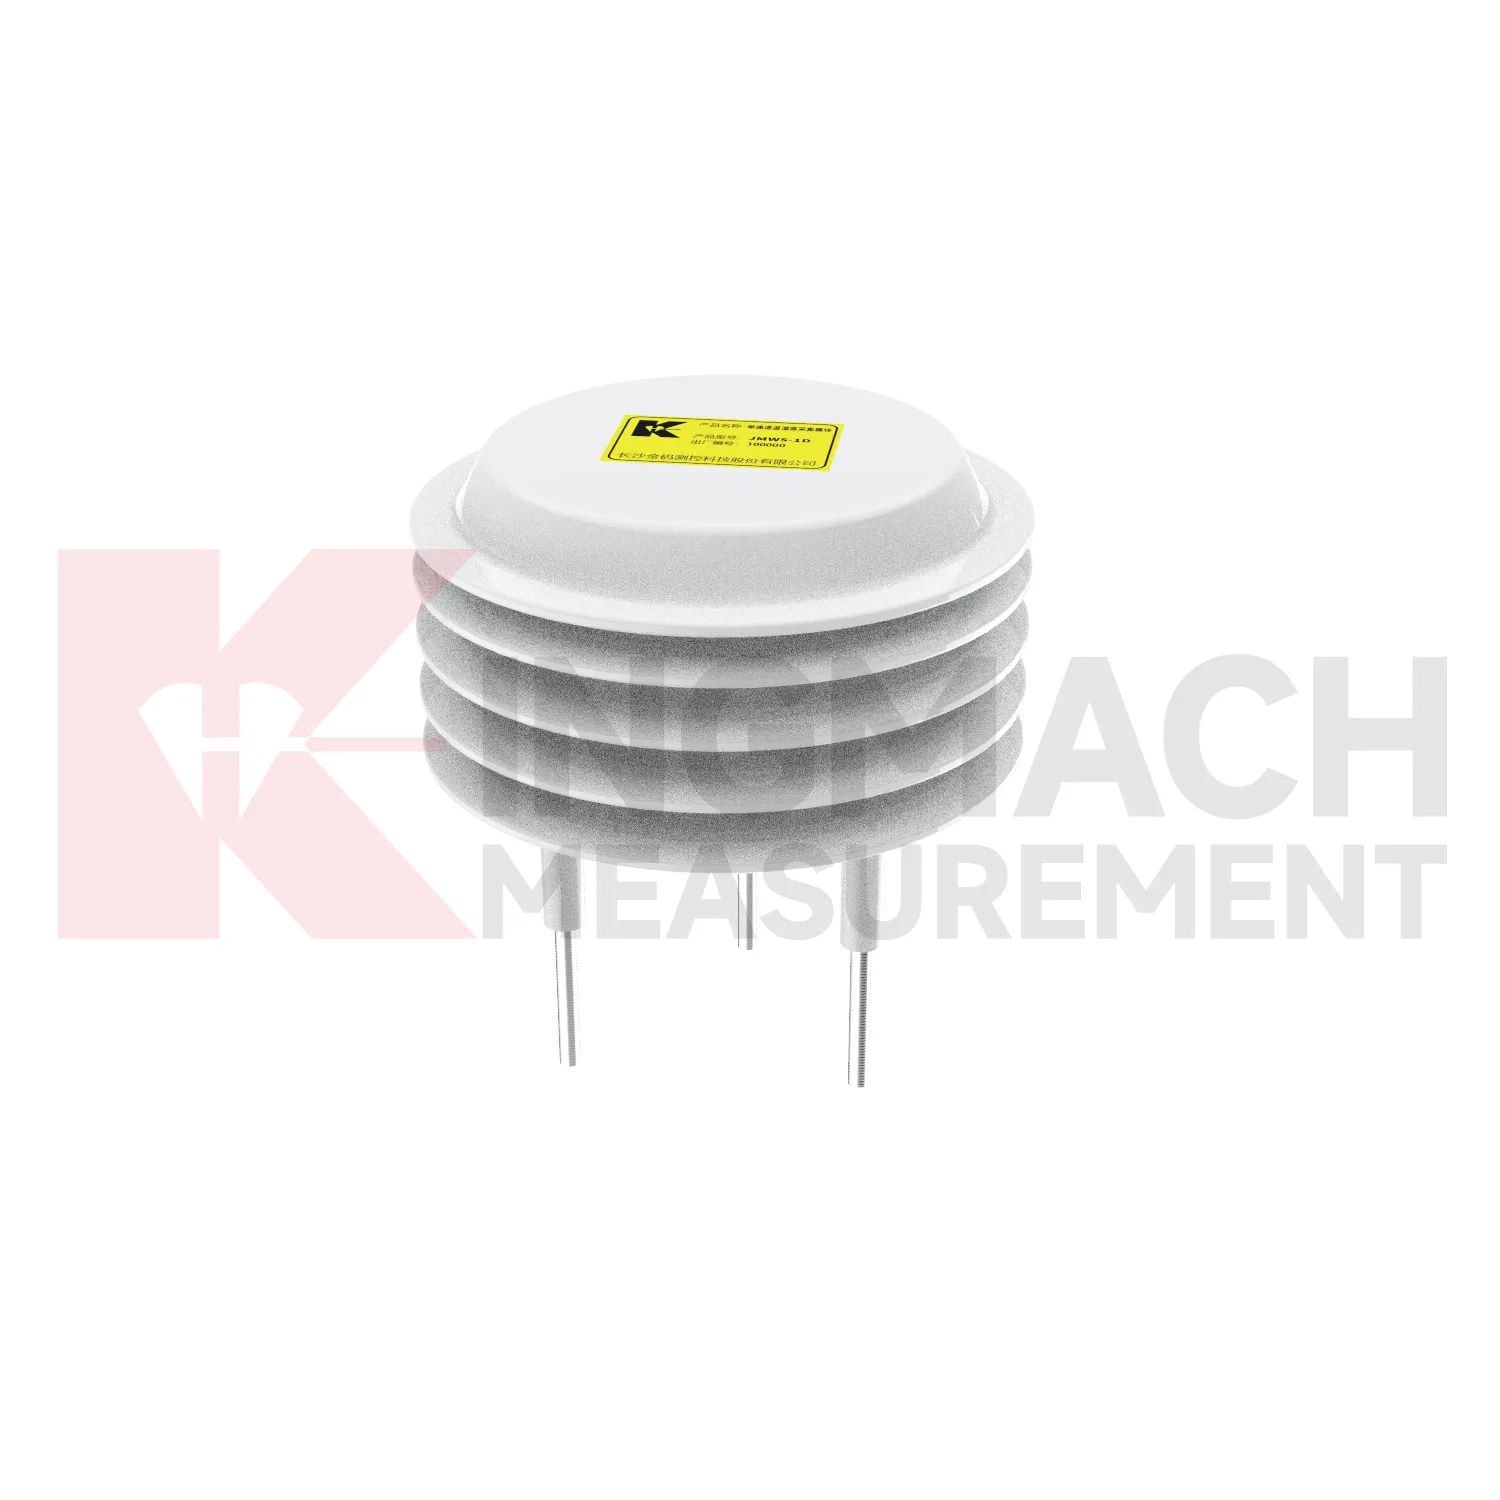
Daisy-Chained Digital Thermometer
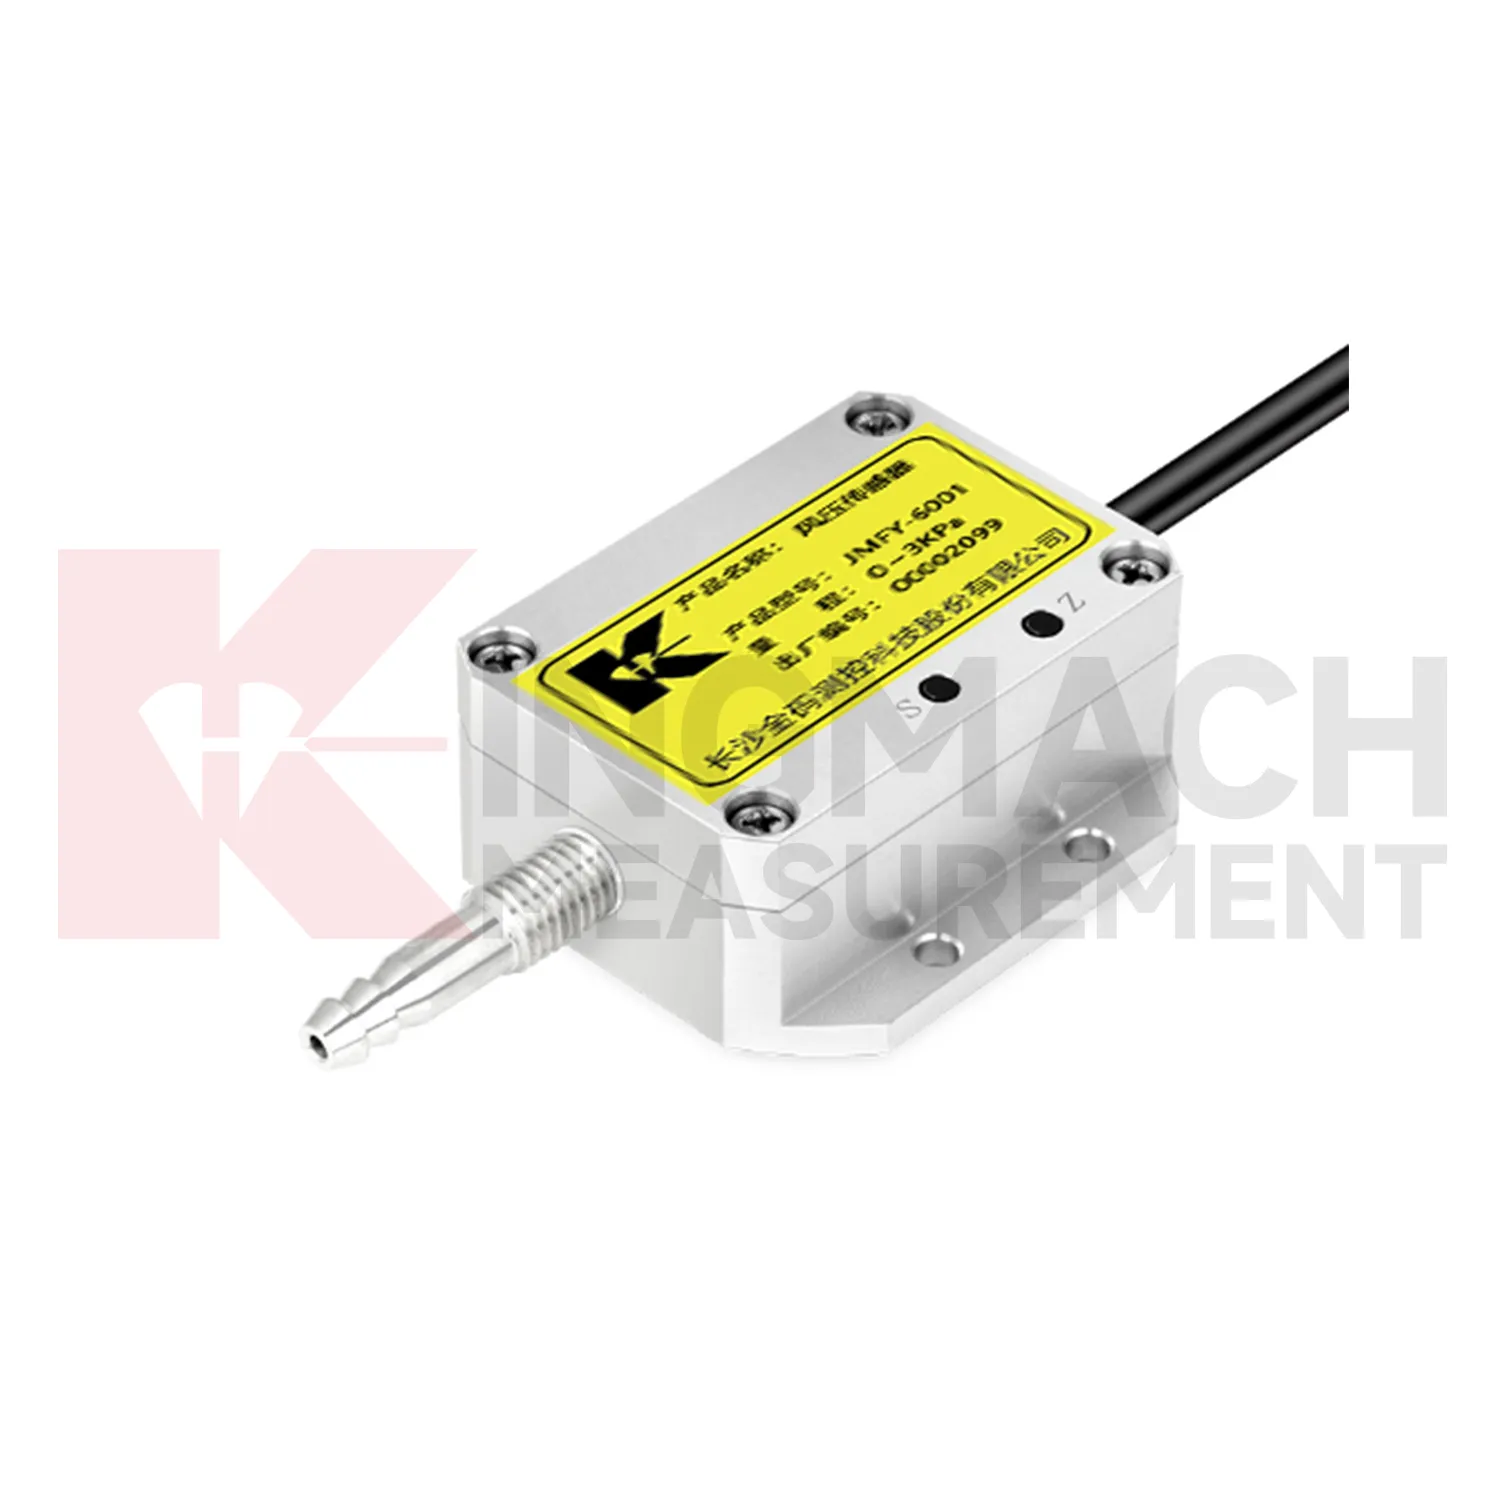
Pressure monitoring in Kingmach Daisy-Chained Digital Thermometer is useful when the project needs to understand wind load, air movement, gas pressure, or controlled pressure differences around equipment and structures. A pressure point may support bridge response review, ventilation systems, enclosed spaces, dry gas control, or antechamber monitoring. The installation should protect the pressure path from blockage, water, dust, loose tubing, and accidental disconnection. Because pressure data often changes quickly, channel naming and time alignment are important. If pressure is being compared with vibration, wind speed, or structural movement, the records should share a review timeline. A pressure value without context may be hard to judge. A pressure value connected to wind direction, operating condition, and structural response can explain why a vibration, alarm, or access issue occurred.
For owners, the strongest record is the one that remains understandable after staff changes. Clear units, plain point names, installation photos, maintenance notes, and linked structural channels make the data usable beyond the original project team.
For field teams, this point is most useful when the record shows the condition before the structural response, during the response, and after the site returns to routine operation. The note should include weather timing, inspection access, nearby construction, and whether the linked structural points changed in the same period.


Application of Daisy-Chained Digital Thermometer
Construction sites use Kingmach Daisy-Chained Digital Thermometer to document conditions that affect work, monitoring data, and later dispute review. Rain can change excavation safety, slope behavior, access roads, concrete work, and water management. Wind can affect lifting, temporary structures, and exposed frames. Temperature and humidity can affect curing, equipment rooms, and sensor cabinets. Environmental data should be collected where it represents the active work zone and should be reviewed beside displacement, settlement, vibration, crack, and inspection records. If a movement change occurs after a storm or heavy wind event, the environmental timeline helps engineers explain the timing. It also gives contractors and owners a shared record instead of relying on memory or informal weather notes.
A practical report links the condition value with time, place, and action. It should help a reviewer decide whether to keep observing, inspect the field point, compare nearby instruments, or record the event as normal site behavior.
For owners, the strongest record is the one that remains understandable after staff changes. Clear units, plain point names, installation photos, maintenance notes, and linked structural channels make the data usable beyond the original project team.
For field teams, this point is most useful when the record shows the condition before the structural response, during the response, and after the site returns to routine operation. The note should include weather timing, inspection access, nearby construction, and whether the linked structural points changed in the same period.
The future of Daisy-Chained Digital Thermometer
Future Kingmach Daisy-Chained Digital Thermometer will be grouped around engineering questions. A slope group may include rainfall, soil wetness, displacement, tilt, and pore pressure. A bridge group may include wind, temperature, strain, acceleration, and displacement. A tunnel group may include humidity, temperature, seepage, settlement, and convergence. This grouping is more useful than arranging channels only by sensor family. Owners review risks, not instrument categories. When dashboards and reports follow the risk, environmental data becomes easier for field teams to use during both routine review and abnormal events.
Maintenance teams should record cleaning, access difficulty, enclosure condition, cable repair, vegetation growth, nearby equipment changes, and the first normal reading after work. Those notes protect the meaning of the curve when old data is reviewed months later.
The environmental point should be part of a named monitoring question. It may explain wetting, drying, wind exposure, thermal movement, cabinet stress, or pressure variation, but that purpose needs to be visible in drawings and reports.
Care & Maintenance of Daisy-Chained Digital Thermometer
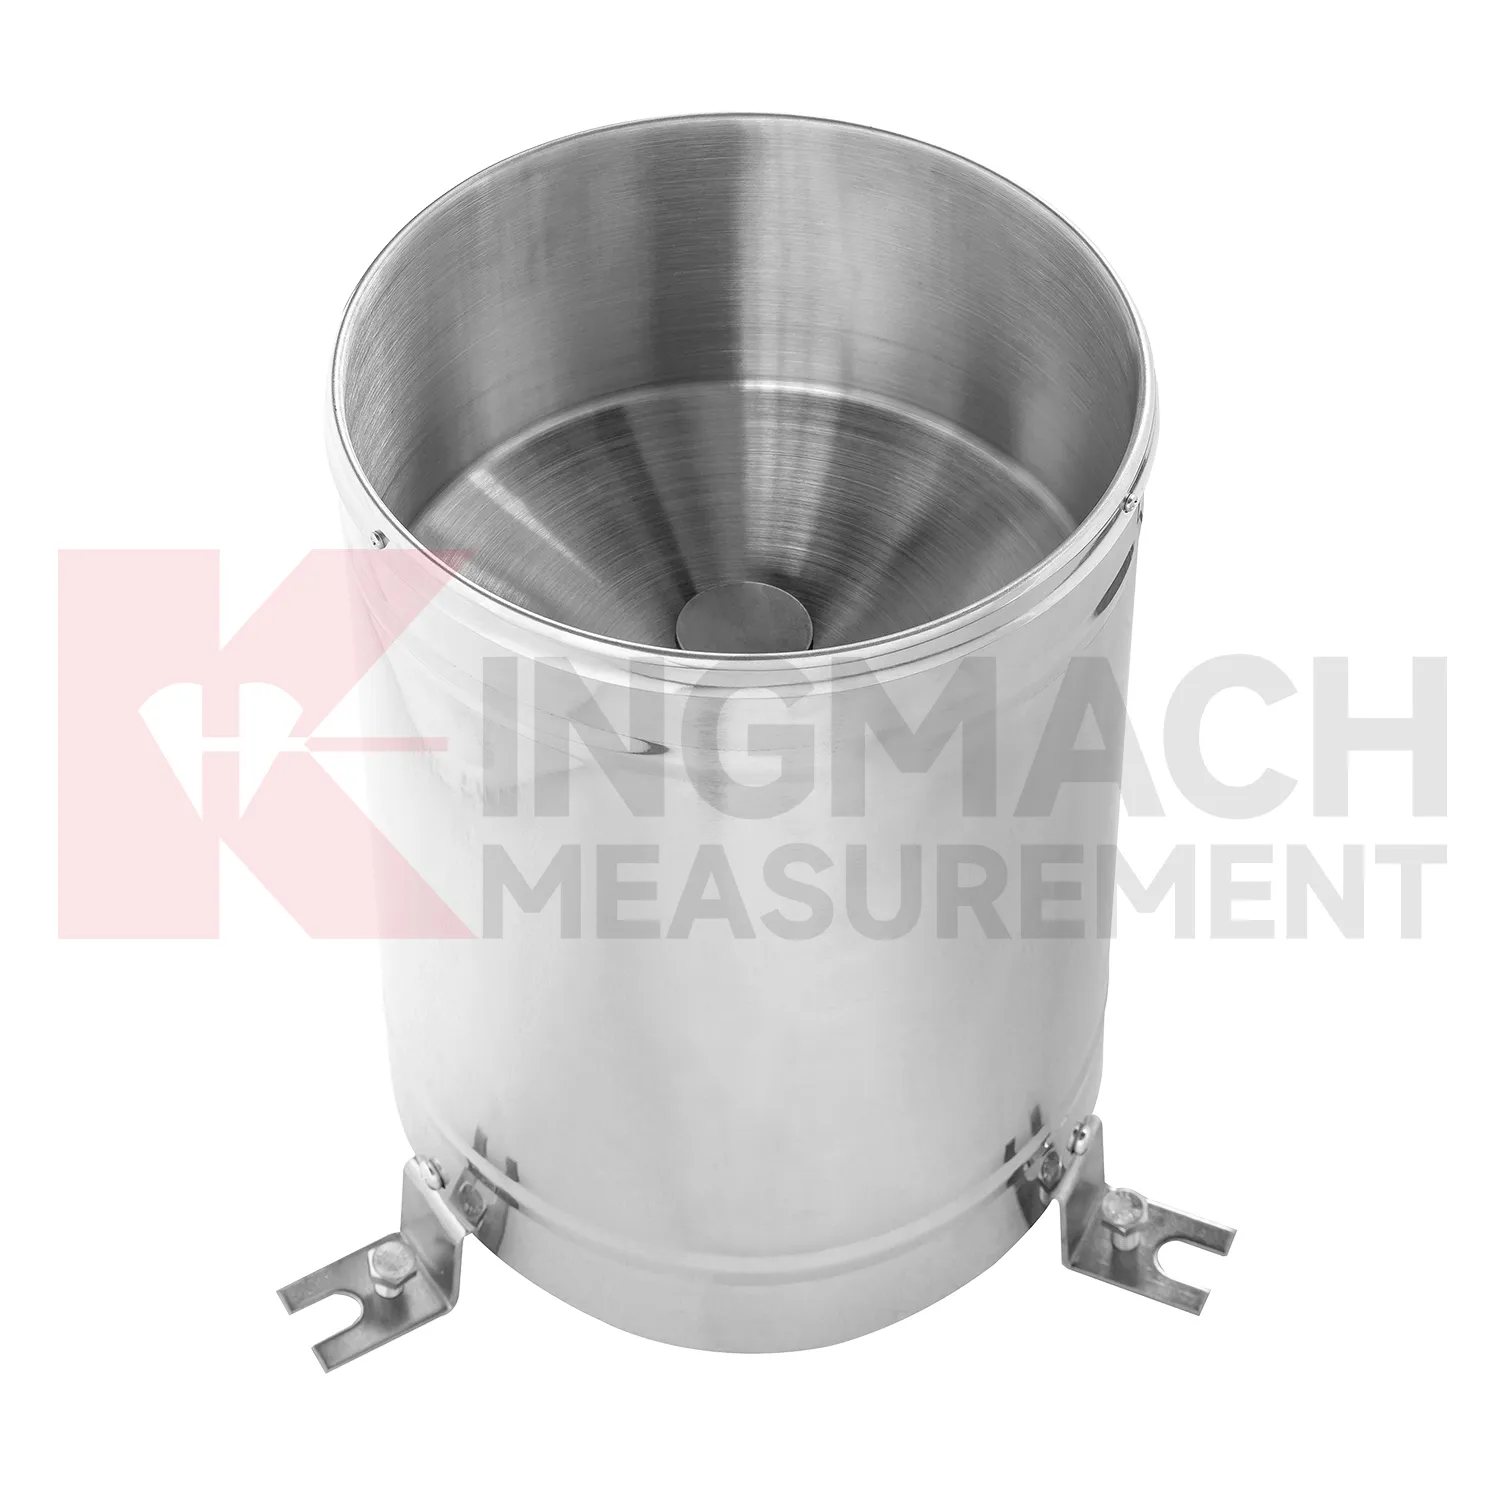
Rainfall maintenance for Kingmach Daisy-Chained Digital Thermometer should focus on keeping the catchment path clean and level. Leaves, dust, insects, scale, bird droppings, splash, and tilted mounting can distort rainfall records. The rain point should be inspected after storms, long dry periods, nearby earthwork, and seasonal debris build-up. Cleaning should be logged with date, condition, leveling status, and the first normal reading after work. Rainfall data is often used to explain slope movement, seepage, tunnel leakage, construction delay, or drainage performance. If the rain record is wrong, the engineering interpretation may also be wrong. Simple field care protects a much larger monitoring decision.
Maintenance teams should record cleaning, access difficulty, enclosure condition, cable repair, vegetation growth, nearby equipment changes, and the first normal reading after work. Those notes protect the meaning of the curve when old data is reviewed months later.
The environmental point should be part of a named monitoring question. It may explain wetting, drying, wind exposure, thermal movement, cabinet stress, or pressure variation, but that purpose needs to be visible in drawings and reports.
Kingmach Daisy-Chained Digital Thermometer
Rainfall records are a central part of Kingmach Daisy-Chained Digital Thermometer for slopes, embankments, dams, tunnel portals, and construction sites. Rain does not always cause immediate movement; water may enter the ground, raise pore pressure, soften material, or change runoff over time. That delay is exactly why a dated rainfall record matters. Engineers can compare the storm start, rainfall duration, peak intensity, soil response, and movement curve. Without that record, a slope alarm may be discussed as a vague weather event. With it, the team can see whether movement followed the storm, whether it continued after rain stopped, and whether field inspection is needed. Rain data becomes part of the engineering timeline rather than a background note.
The environmental point should be part of a named monitoring question. It may explain wetting, drying, wind exposure, thermal movement, cabinet stress, or pressure variation, but that purpose needs to be visible in drawings and reports.
If the reading seems unusual, the team should check the physical condition of the station before drawing conclusions about the asset. Blockage, poor exposure, loose wiring, water entry, and changed surroundings can all create misleading patterns.
FAQ
Q: What does Kingmach Daisy-Chained Digital Thermometer measure?
A: It measures site conditions such as rainfall, wind, temperature, humidity, pressure, and soil wetness so engineers can compare the environment with structural or ground behavior.
Q: Why is this data important?
A: Environmental conditions often explain why deformation, vibration, seepage, cabinet faults, or strain changes occur at a particular time.
Q: Should these records be reviewed alone?
A: No. They are most useful when placed beside settlement, displacement, tilt, load, strain, vibration, inspection notes, and maintenance records.
Q: How should a station be planned?
A: Start with the engineering risk, then decide which condition must be measured, where it should be measured, and which structural record it supports.
Q: What makes a good environmental record?
A: Clear location, correct units, stable placement, protected hardware, time alignment, and visible maintenance notes make the record useful over time.
During abnormal events, the first question is not only whether the value crossed a limit. The reviewer should ask what changed around the site, whether the related structure reacted, and whether a field inspection confirmed the same pattern.
Reviews
Michael Anderson
The strain gauges and load cells are extremely accurate and stable. They performed very well in our bridge monitoring project. Highly recommended!
Andrew Lee
The visualization software is intuitive and powerful. It helps us analyze monitoring data efficiently.
Latest Inquiries
To protect the privacy of our buyers, only public service email domains like Gmail, Yahoo, and MSN will be displayed. Additionally, only a limited portion of the inquiry content will be shown.
Ava***@gmail.comAustralia
Hi, I am looking for reliable tiltmeters and accelerometers for structural health monitoring. Please...
Charlotte***@gmail.comUnited Arab Emirates
Hi, we require instrumentation cables suitable for harsh environments. Could you advise on specifica...
Related product categories
- wind pressure sensor
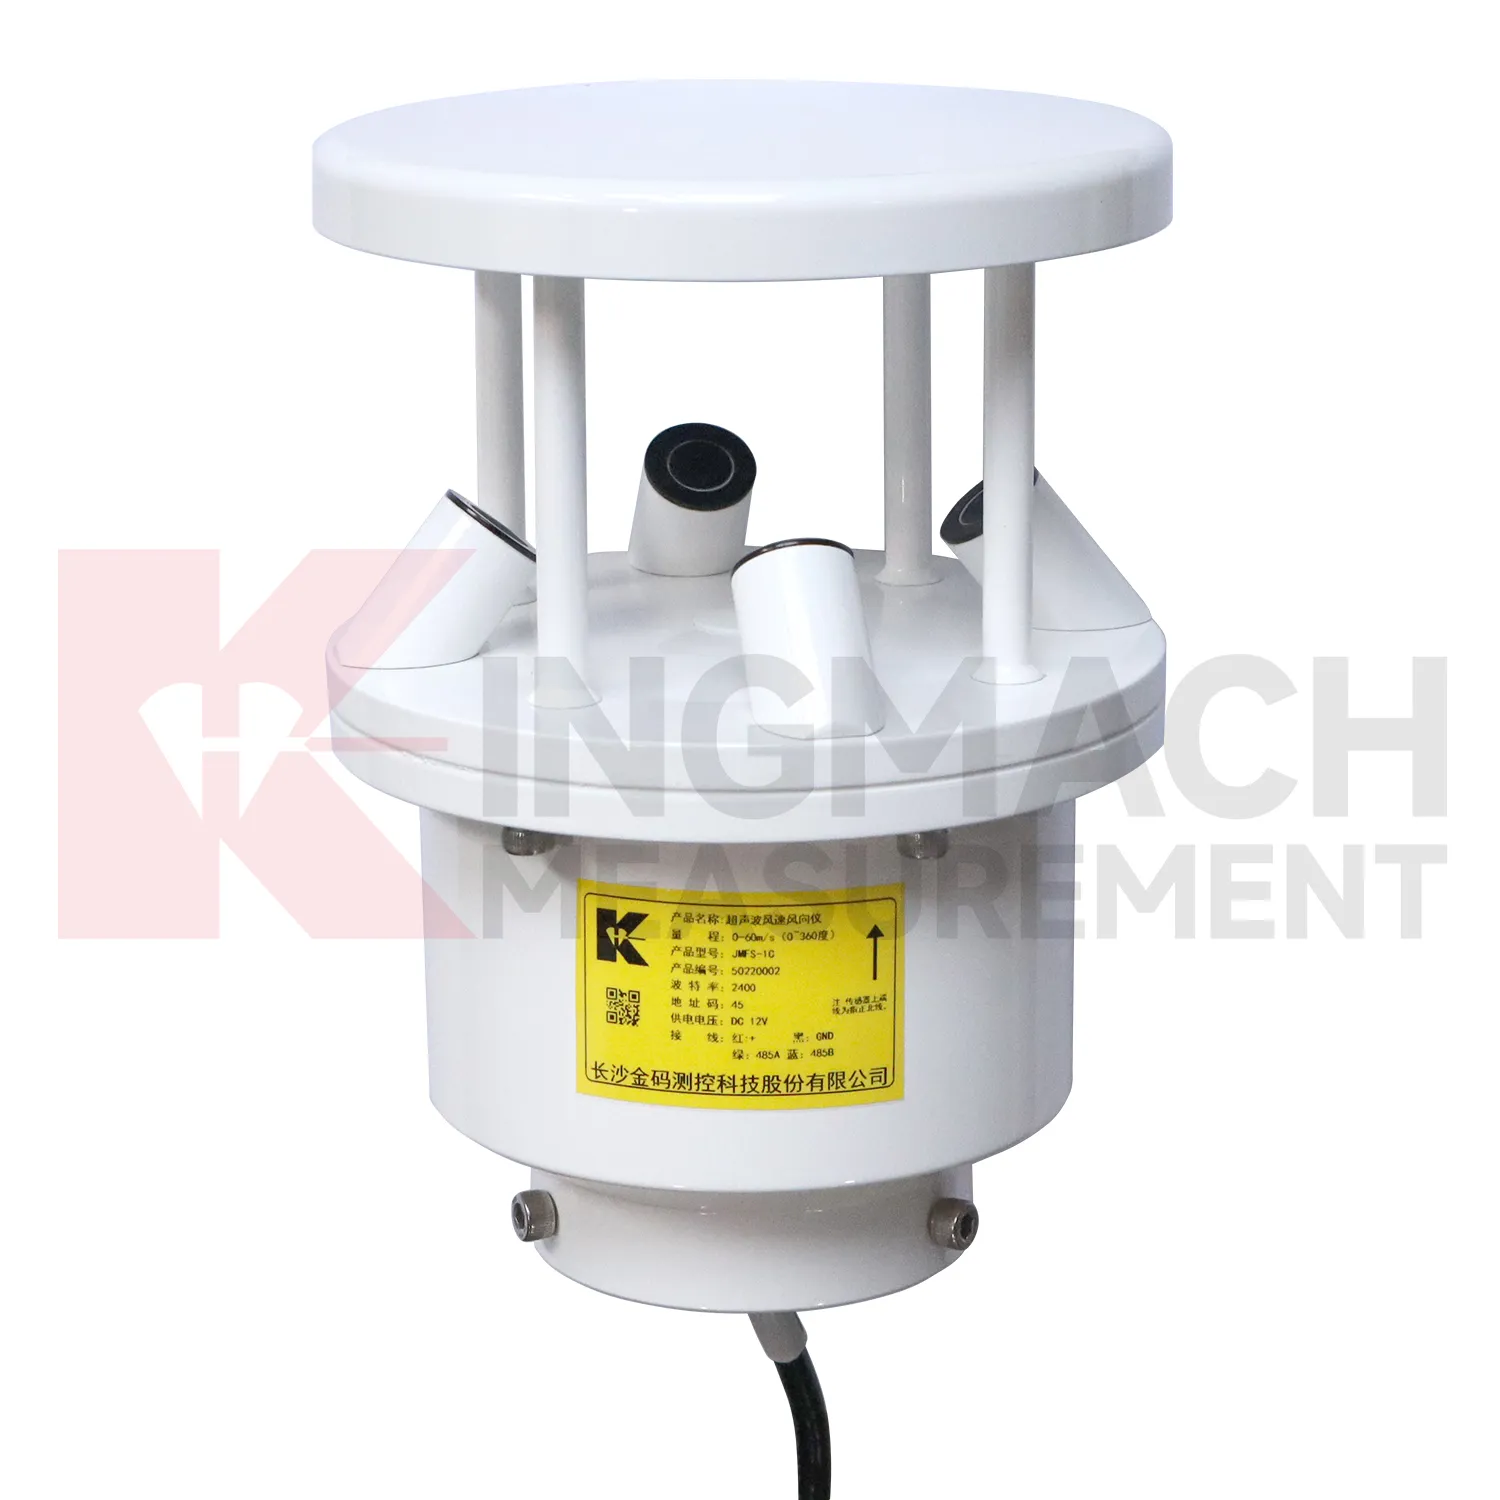
- ultrasonic wind speed and direction sensor
- wind speed and direction sensor
- wind speed and wind direction sensor
- wind speed and direct sensor
- wireless wind speed and direction sensor
- wind direction and speed sensor
- wind speed and direction sensors
- tipping bucket rain gauge
- tipping bucket rain gauge resolution 0.2 mm standard
- tipping bucket rain gauges
- tipping bucket rain gauge resolution 0.1 mm 0.2 mm standard