 ar
ar bg
bg hr
hr cs
cs da
da nl
nl fi
fi fr
fr de
de el
el hi
hi it
it ko
ko no
no pl
pl pt
pt ro
ro ru
ru es
es sv
sv tl
tl iw
iw id
id lv
lv lt
lt sr
sr sk
sk sl
sl uk
uk vi
vi et
et hu
hu th
th tr
tr fa
fa ms
ms hy
hy ka
ka ur
ur bn
bn mn
mn ta
ta kk
kk uz
uz ku
ku
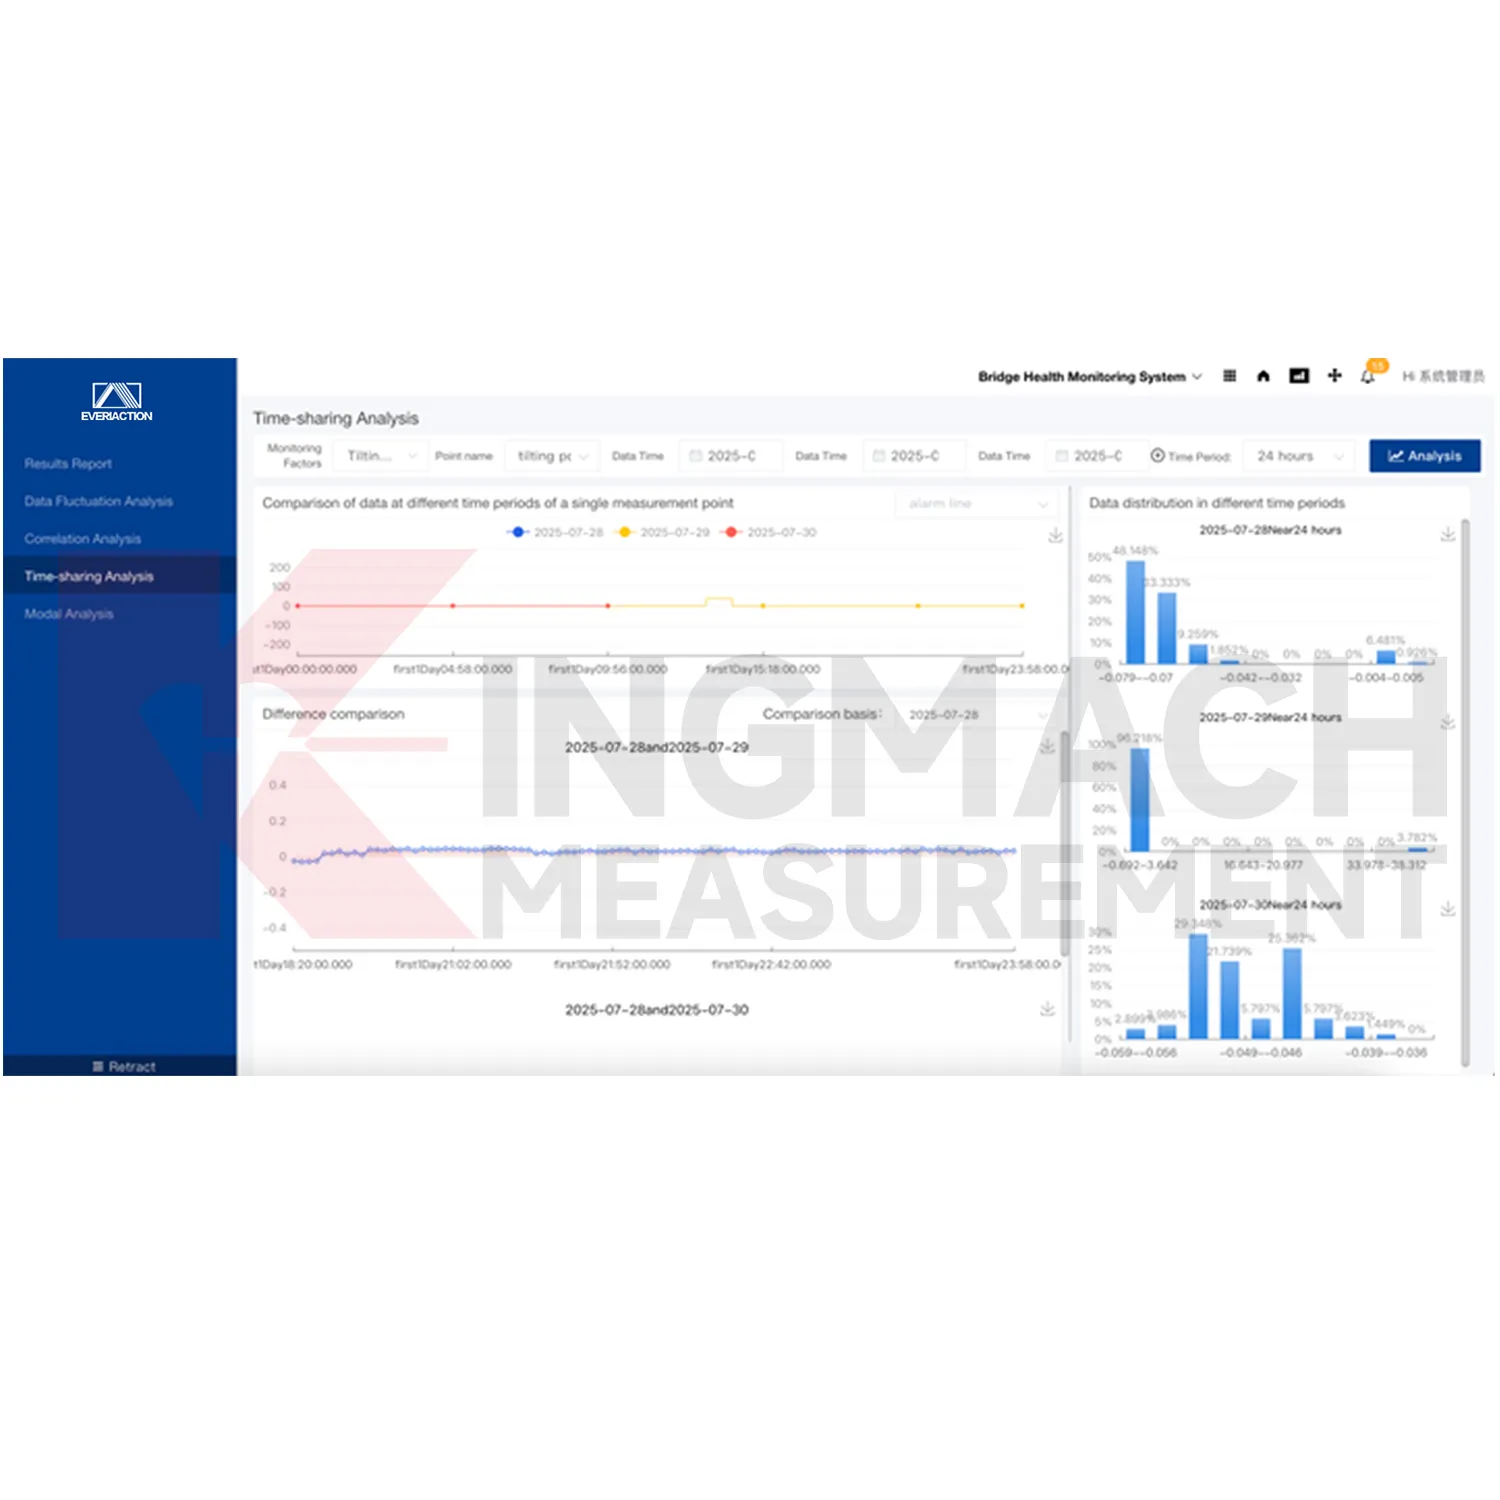
Visualization Software
Kingmach Visualization Software can work with different sensor categories across the Kingmach product ecosystem. It may receive data from strain gauges, load cells, displacement transducers, settlement sensors, tiltmeters, environmental monitoring devices, accelerometers, weir flow meters, readouts, data loggers, and related acquisition hardware. The benefit is not only that the data appears on one screen. The benefit is that related structural behavior can be compared across channels, making it easier to understand whether a change is local, environmental, construction-related, or part of a wider asset response.
Application of Visualization Software
Building monitoring uses Kingmach Visualization Software when settlement, tilt, crack displacement, vibration, temperature, or foundation pit influence must be reviewed over time. Urban projects often involve nearby construction, traffic, equipment vibration, and changing occupancy conditions. The platform helps organize sensor readings and alarms by project, making it easier to compare today's behavior with baseline records. Graphical display is useful for owners and engineers who need to understand whether movement is stable, event-related, or growing.
The future of Visualization Software
Digital twin projects will use Kingmach Visualization Software as the live data layer behind structural models. A twin needs current readings, historical trends, device identity, alarm status, and inspection records to stay meaningful. The platform can help feed that model with organized monitoring data from many instrument types. When a bridge, tunnel, dam, building, or slope changes, the twin can be updated with both sensor evidence and field notes, making the virtual record closer to the real asset condition.
Care & Maintenance of Visualization Software
Device access for Kingmach Visualization Software should be checked carefully during commissioning. Confirm whether each instrument or acquisition module is sending data by the planned wired or wireless method. Verify channel identity, unit, timestamp, point location, and first stable value before the platform is accepted. A clean commissioning record prevents later confusion when an alarm appears. If a channel is missing, duplicated, or mislabeled, fix the data path before routine monitoring begins.
Kingmach Visualization Software
Kingmach Visualization Software makes reporting easier because monitoring evidence is already organized by project, device, channel, trend, alarm, and document. Registered experts can issue professional result reports through the platform workflow described in the local product file. For owners, reports need to explain what changed, where it happened, which instruments confirmed it, and what field action followed. A platform that stores data, filters records, generates visual trends, and keeps project documents together makes that reporting process more traceable than manual consolidation after the event.
FAQ
Q: Who should receive accounts?
A: Give access only to the owner, operator, engineer, inspector, or reviewer roles that need the platform.
Q: What does an operator need?
A: An operator needs status, active alarms, communication condition, and recent abnormal records.
Q: What does an engineer need?
A: An engineer needs trend comparison, related channels, event notes, and inspection records.
Q: What supports later expansion?
A: Stable project names, point names, device IDs, and channel maps make new device access easier.
Q: What belongs in handover?
A: Provide accounts, permissions, device list, channel map, alarm rules, report setup, backup method, and recent data notes.
Reviews
Christopher Martinez
Very satisfied with the readouts & data loggers. User-friendly interface and supports multiple sensor inputs.
Robert Taylor
The weir flow meter is well-built and delivers accurate measurements. Great value for water management applications.
Latest Inquiries
To protect the privacy of our buyers, only public service email domains like Gmail, Yahoo, and MSN will be displayed. Additionally, only a limited portion of the inquiry content will be shown.
Mia***@gmail.comNetherlands
Dear team, we are interested in your readouts & data loggers compatible with multiple sensors. Do yo...
Charlotte***@gmail.comUnited Arab Emirates
Hi, we require instrumentation cables suitable for harsh environments. Could you advise on specifica...
Related product categories
- Monitoring Software Suite
- Monitoring system software platform
- Environmental Monitoring
- Visualization Software
- GPS Displacement Monitoring System
- Integrated Monitoring Station
- Settlement Monitoring Rod
- Structural Health Monitoring (SHM) System
- Structural Monitoring Cloud Platform
- IoT Online Monitoring System
- Monitoring System Platform & Services
- Engineering Pulse Intelligent Monitoring Cloud Platform